Pattern Fills
They are only supported for the SVG renderer and will not work for Canvas. Please bear these points in mind if looking to port a specification elsewhere.
Overview
There are a range of SVG fill patterns available wherever a color, stroke or fill can be used in a mark's property. These are based on the excellent work of Irene Ros.
Because SVG patterns have to be explicitly defined inside a web page, we can't add all possible combinations of colors and patterns without significant performance reduction. Therefore the functionality is split into two components:
- Default Patterns: pre-defined monochrome patterns, which are a good starting point for many data visualization use cases.
- Dynamic Variations: a custom expression function to generate variations of the default patterns with a specific foreground and/or background color.
Default Patterns
Default patterns are referenced using the following syntax:
url(#[pattern name])
For example, if we want to use the diagonal-stripe-1 pattern, we would refer to this as follows:
url(#diagonal-stripe-1)
So, instead of shading our example bar chart from the formatting page with a color, we could use this instead, e.g.:
{
  "data": { "name": "dataset" },
  "mark": {
    "type": "bar",
    "fill": "url(#diagonal-stripe-1)"
  },
  "encoding": {
    "y": {
      "field": "Country",
      "type": "nominal"
    },
    "x": {
      "field": "$ Sales",
      "type": "quantitative"
    }
  }
}
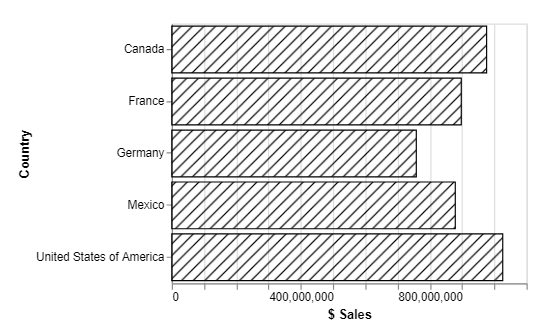
And instead of a solid fill, we would now get the following rendered visual:
![Simple bar chart using Financial sample dataset (with [$ Sales] as a measure). The measure axis displays raw values, with a maximum of 1,000,000,000. We have specified the 'diagonal-stripe-1' pattern fill to fill the bars with a pattern instead of a solid color. vega-lite-diagonal-stripe-1.png](/assets/images/vega-lite-diagonal-stripe-1-8e119801ca07424995d2f530e2246b11.png)
We could augment this with a stroke to provide a boundary to the mark, e.g.:
{
  "data": { "name": "dataset" },
  "mark": {
    "type": "bar",
    "fill": "url(#diagonal-stripe-1)",
    "stroke": "black"
  },
  "encoding": {
    "y": {
      "field": "Country",
      "type": "nominal"
    },
    "x": {
      "field": "$ Sales",
      "type": "quantitative"
    }
  }
}

Backgrounds
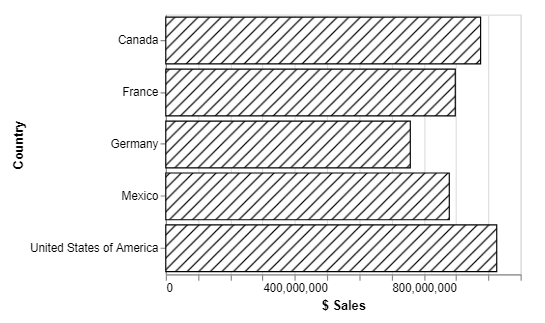
Default patterns have a transparent background, and this can be observed in the above example with the x-axis gridlines. If you want to provide a solid background, you can either use the dynamic pattern variation expression, or layer a mark behind it with a solid fill, e.g.:
{
  "data": { "name": "dataset" },
  "layer": [
    {
      "mark": {
        "type": "bar",
        "fill": "white"
      }
    },
    {
      "mark": {
        "type": "bar",
        "fill": "url(#diagonal-stripe-1)",
        "stroke": "black"
      }
    }
  ],
  "encoding": {
    "y": {
      "field": "Country",
      "type": "nominal"
    },
    "x": {
      "field": "$ Sales",
      "type": "quantitative"
    }
  }
}

Intensity Modifier
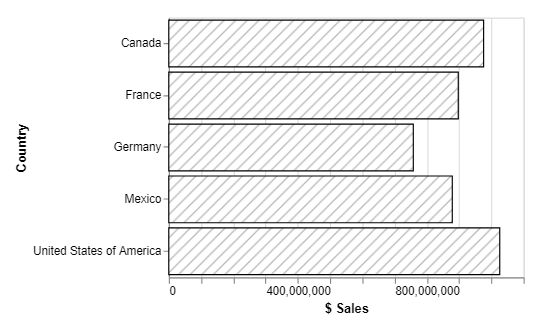
Default patterns also have a modifier suffix that can be added to reduce the intensity of the stroke from black (#000000) to a softer color. These are in intervals of 10, from 10 to 90, and also at the 1st and 3rd quartiles (25 and 75).
So, for our above example, if we wish to reduce the stroke intensity down to 30%, we can use url(#diagonal-stripe-1-30), e.g.:
{
  "data": { "name": "dataset" },
  "layer": [
    {
      "mark": {
        "type": "bar",
        "fill": "white"
      }
    },
    {
      "mark": {
        "type": "bar",
        "fill": "url(#diagonal-stripe-1-30)",
        "stroke": "black"
      }
    }
  ],
  "encoding": {
    "y": {
      "field": "Country",
      "type": "nominal"
    },
    "x": {
      "field": "$ Sales",
      "type": "quantitative"
    }
  }
}

Available Patterns
The following Power BI report shows all available pre-defined patterns and their SVG URL IDs.
- You can hover over a pattern to get a tooltip showing its ID in a larger font, as well as how the SVG URL should look in order to apply it.
- The slicer at the bottom of the page can be used to observe the patterns at the specified intensity, and the SVG URL ID required to apply it.
Dynamic Variations
If you wish to use more color in your patterns, then Deneb provides an expression function that you can use. This will dynamically generate and apply a variation of a default SVG pattern definition to the visual's DOM, and re-use them if necessary.
The pbiPatternSVG Expression Function
The function has the following syntax within a Vega or Vega-Lite expression ref:
pbiPatternSVG(pattern, foreground, background)
Where:
-
patternis one of the pre-defined pattern IDs above, enclosed with single quotes.- The
#used in the SVG URL should not be included here. - If an unknown (or invalid)
patternis provided, then this will result in no fill being applied.
- The
-
foregroundis a valid CSS color name or hex value, enclosed with single quotes.- If
foregroundis omitted (ornull), Deneb will resolve this back to the value used by the default pattern (black). transparentis a permitted value, and this will effectively hide the pattern stroke from the reader.foregroundoverrides the intensity modifier, if this is supplied inpattern.
- If
-
backgroundis a valid CSS color name or hex value, enclosed with single quotes.- If
backgroundis omitted, then Deneb will produce a transparent background for the generated pattern.
- If
Simple Example - Mark Properties
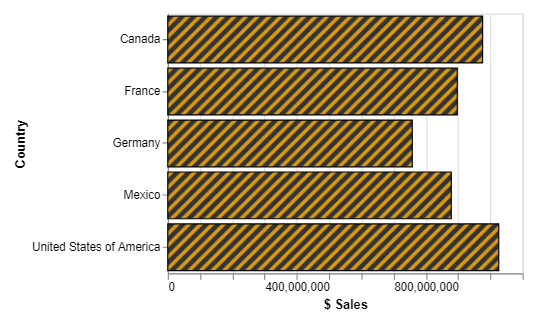
If we wanted to apply a custom foreground and background, we could use pbiPatternSVG in an expression function as follows:
{
  "data": { "name": "dataset" },
  "mark": {
    "type": "bar",
    "fill": {
      "expr": "pbiPatternSVG('diagonal-stripe-3', '#DA9A0F', '#333333')"
    },
    "stroke": "black"
  },
  "encoding": {
    "y": {
      "field": "Country",
      "type": "nominal"
    },
    "x": {
      "field": "$ Sales",
      "type": "quantitative"
    }
  }
}
