Formatting Values
Default Formatting Behavior
When it comes to formatting values (if you're just using simple encodings), then Vega or Vega-Lite will use its own deterministic behavior to figure out things like decimal precision or other elements.
You can provide your own overrides to these wherever they are used. Vega and Vega-Lite both use the D3 formatting convention for numbers and date & time values (incidentally, so does Charticulator).
Power BI has its own syntax, which is probably your preference for applying any customized formatting strings into a specification.
To ensure correct compatibility with Vega and Vega-Lite, particularly if you're bringing examples in (or even looking to take them out!) Deneb will use the D3 convention by default, but there's some help at hand if that's not your preference.
Power BI Custom Formatter
If you prefer working with Power BI format strings, Deneb has a custom format type named pbiFormat that you can use in lieu of the D3 format convention.
Vega-Lite Implementation
In Vega-Lite, we can specify "pbiFormat" as a formatType wherever you're specifying a format.
Quantitative Axis Example
Let's say we have a simple bar chart that uses the Power BI financial sample dataset, which shows [$ Sales] for each [Country]:
{
  "data": {
    "name": "dataset"
  },
  "mark": {
    "type": "bar"
  },
  "encoding": {
    "y": {
      "field": "Country",
      "type": "nominal"
    },
    "x": {
      "field": "$ Sales",
      "type": "quantitative"
    }
  }
}
And this will result in the following output:
That's a lot of zeroes! What might be nicer is if his were a little easier to read. If we want to use a Power BI format string for this, we can modify the specification as follows to show values in $bn to one decimal place (changes highlighted):
{
  ...
  "encoding": {
    ...
    "x": {
      "field": "$ Sales",
      "type": "quantitative",
      "axis": {
        "format": "$#0,,,.0bn",
        "formatType": "pbiFormat"
      }
    }
  }
}
This results in something a little more human-readable:
Quantitative & Temporal Axes Example
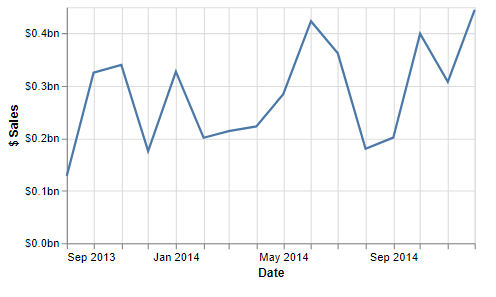
If instead, we had a line chart using the same dataset, but this time we wanted to plot [$ Sales] by [Date] then we could express this as follows:
{
  "data": {
    "name": "dataset"
  },
  "mark": {
    "type": "line"
  },
  "encoding": {
    "x": {
      "field": "Date",
      "type": "temporal"
    },
    "y": {
      "field": "$ Sales",
      "type": "quantitative"
    }
  }
}
And here's how it looks out of the gate:
![Simple line chart using Financial sample dataset (with [$ Sales] as a measure and [Date] along the x-axis). The measure axis displays raw values, with a maximum of just over 400,000,000. vega-lite-line-default.png](/assets/images/vega-lite-line-default-680a675401ae51ea5884385be486051f.png)
We could use a similar approach as above for both axes, to get them how we want (changes highlighted):
{
  ...
  "encoding": {
    "x": {
      ...
      "axis": {
        "format": "MMM yyyy",
        "formatType": "pbiFormat"
      }
    },
    "y": {
      ...
      "axis": {
        "format": "$#0,,,.0bn",
        "formatType": "pbiFormat"
      }
    }
  }
}
And now, we have both axes formatted as we like:

Vega Implementation
If using Vega, you'd call the custom formatter in lieu of the format expression, e.g. for an axis tick label:
{
  ...
  "axes": [
    {
      ...
      "encode": {
        "labels": {
          "update": {
            "text": {
              "signal": "pbiFormat(datum.value, '$#0,,,.0bn')"
            }
          }
        }
      }
    },
    ...
  ],
  ...
}
Locale-Awareness
If using the pbiFormat formatter, Deneb currently will resolve your locale according to your Power BI configuration for any values.
For example, we can view the live chart example from above en français (fr-FR), and the formatting strings will work as expected:
![If we are in a different locale, e.g. French, then our [$ Sales] and [Date] format string update to use locale-specific decimal separators and month naming. vega-lite-line-fr-FR.png](/assets/images/vega-lite-line-fr-FR-8542076a4bf7b890a6b3287dc19e8afc.png)